Bitcoin Price Prediction Based on DXY Analysis
DXY Relationship with Bitcoin
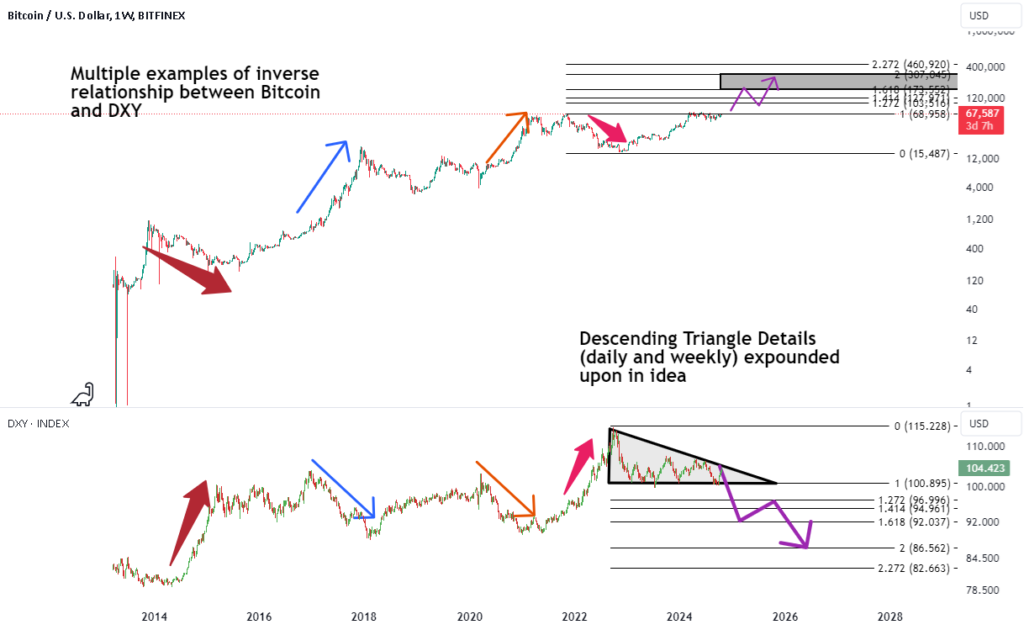
The correlation between DXY and Bitcoin movements
A significant long-term indicator for Bitcoin price is the DXY, comparing the dollar against major currencies. Understanding this relationship can lead to profitable decisions for crypto traders and investors, as history has shown.
Current State of DXY
Analysis of the DXY chart and potential trends
Examining the DXY chart reveals a descending triangle pattern, signaling possible future movements. The current high point of DXY is showing signs of resistance, supported by hidden bearish divergence, indicating a potential downtrend continuation.
Weekly DXY Outlook
On a weekly basis, DXY is facing resistance at a former support level, suggesting a bearish trend. The trend line that previously acted as support is now acting as a barrier for further advancements.
Summary and Future Predictions
Expectations for Bitcoin based on DXY analysis
Given the historical inverse relationship between DXY and Bitcoin, it is likely that this pattern will persist. As DXY shows signs of weakness, Bitcoin may see a corresponding rise. The simplicity of this analysis, supported by basic charting and minimalistic indicators, can guide trading decisions in the cryptocurrency market.
With a long position in crypto assets, the future plans are based on this analysis. Stay informed about related ideas that shape this perspective for the upcoming year.
The information in the article is for informational purposes only. It does not constitute any investment advice. The author and CryptoBlockNews.com are not responsible for your profits or losses arising from your investments. Investment is ultimately based on many foundations such as knowledge, accumulation, experience, research and personal decisions.